Ask a business question. Get an analysis you can stand behind.
Ask a business question about your own data, in plain words. Evident computes every number in code, has the AI choose and write up what matters, and checks every sentence before you see it. You get a Story with the check behind every figure, a dashboard of the wider picture, and a deck ready to present.
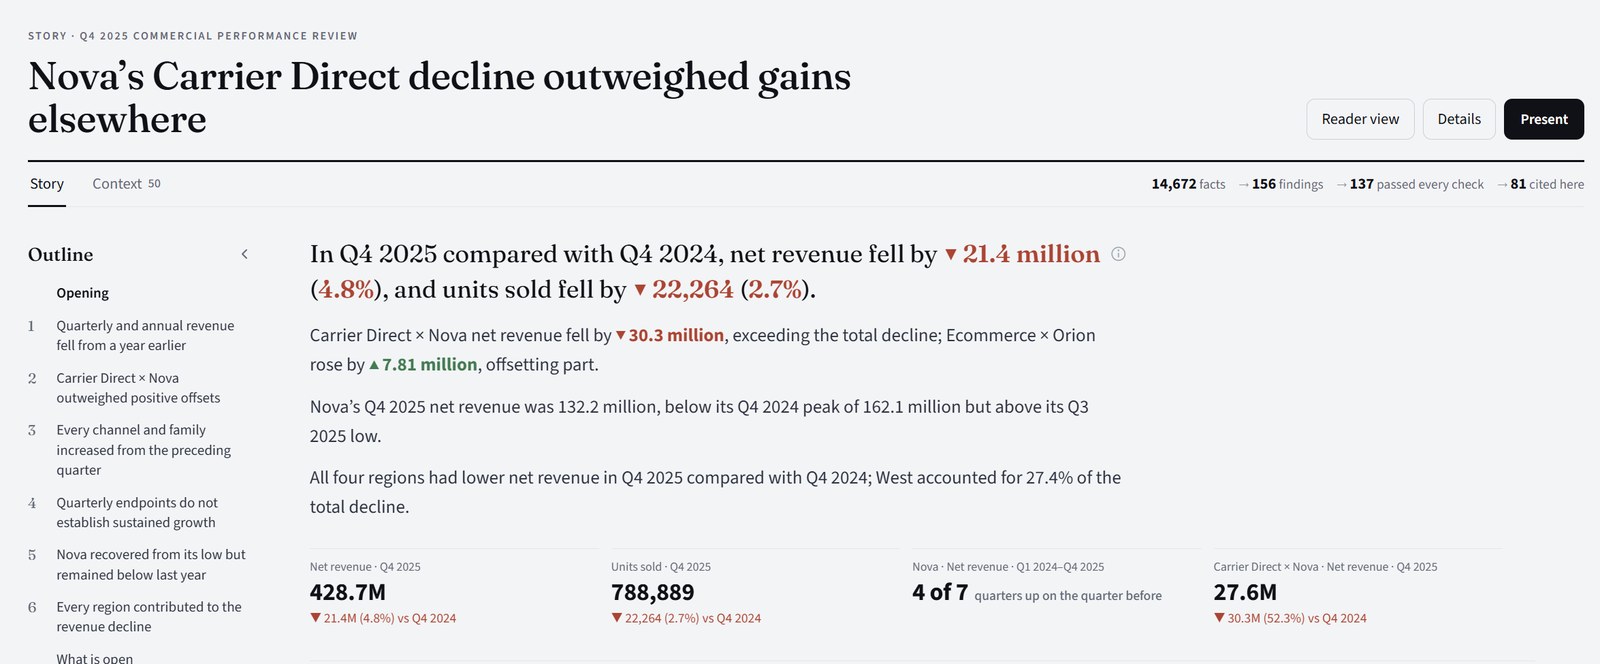
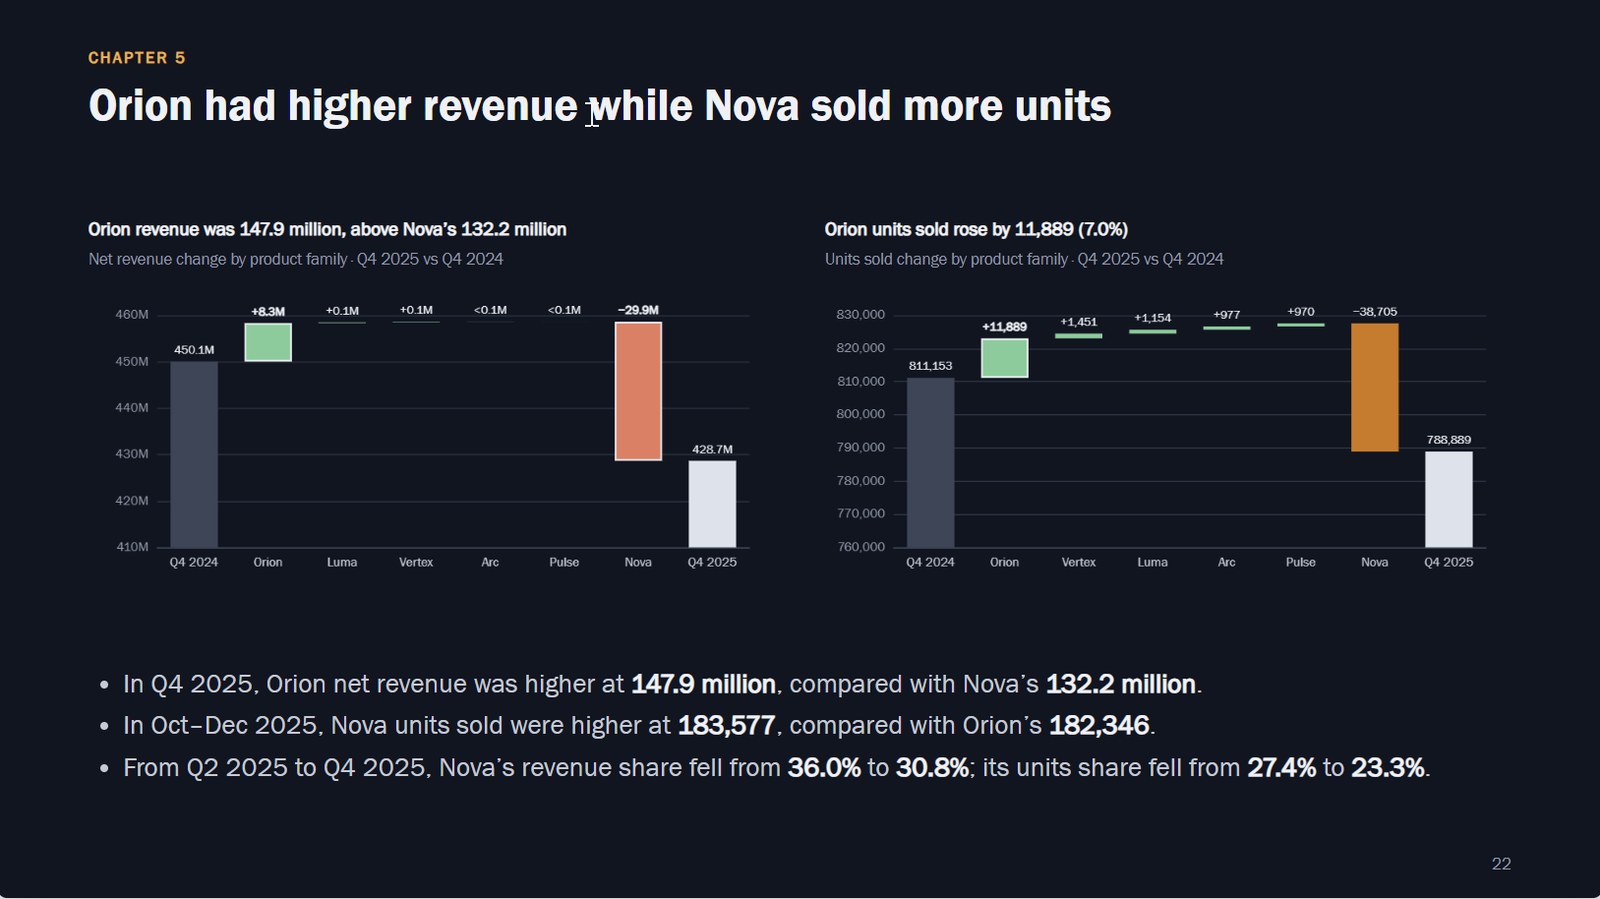
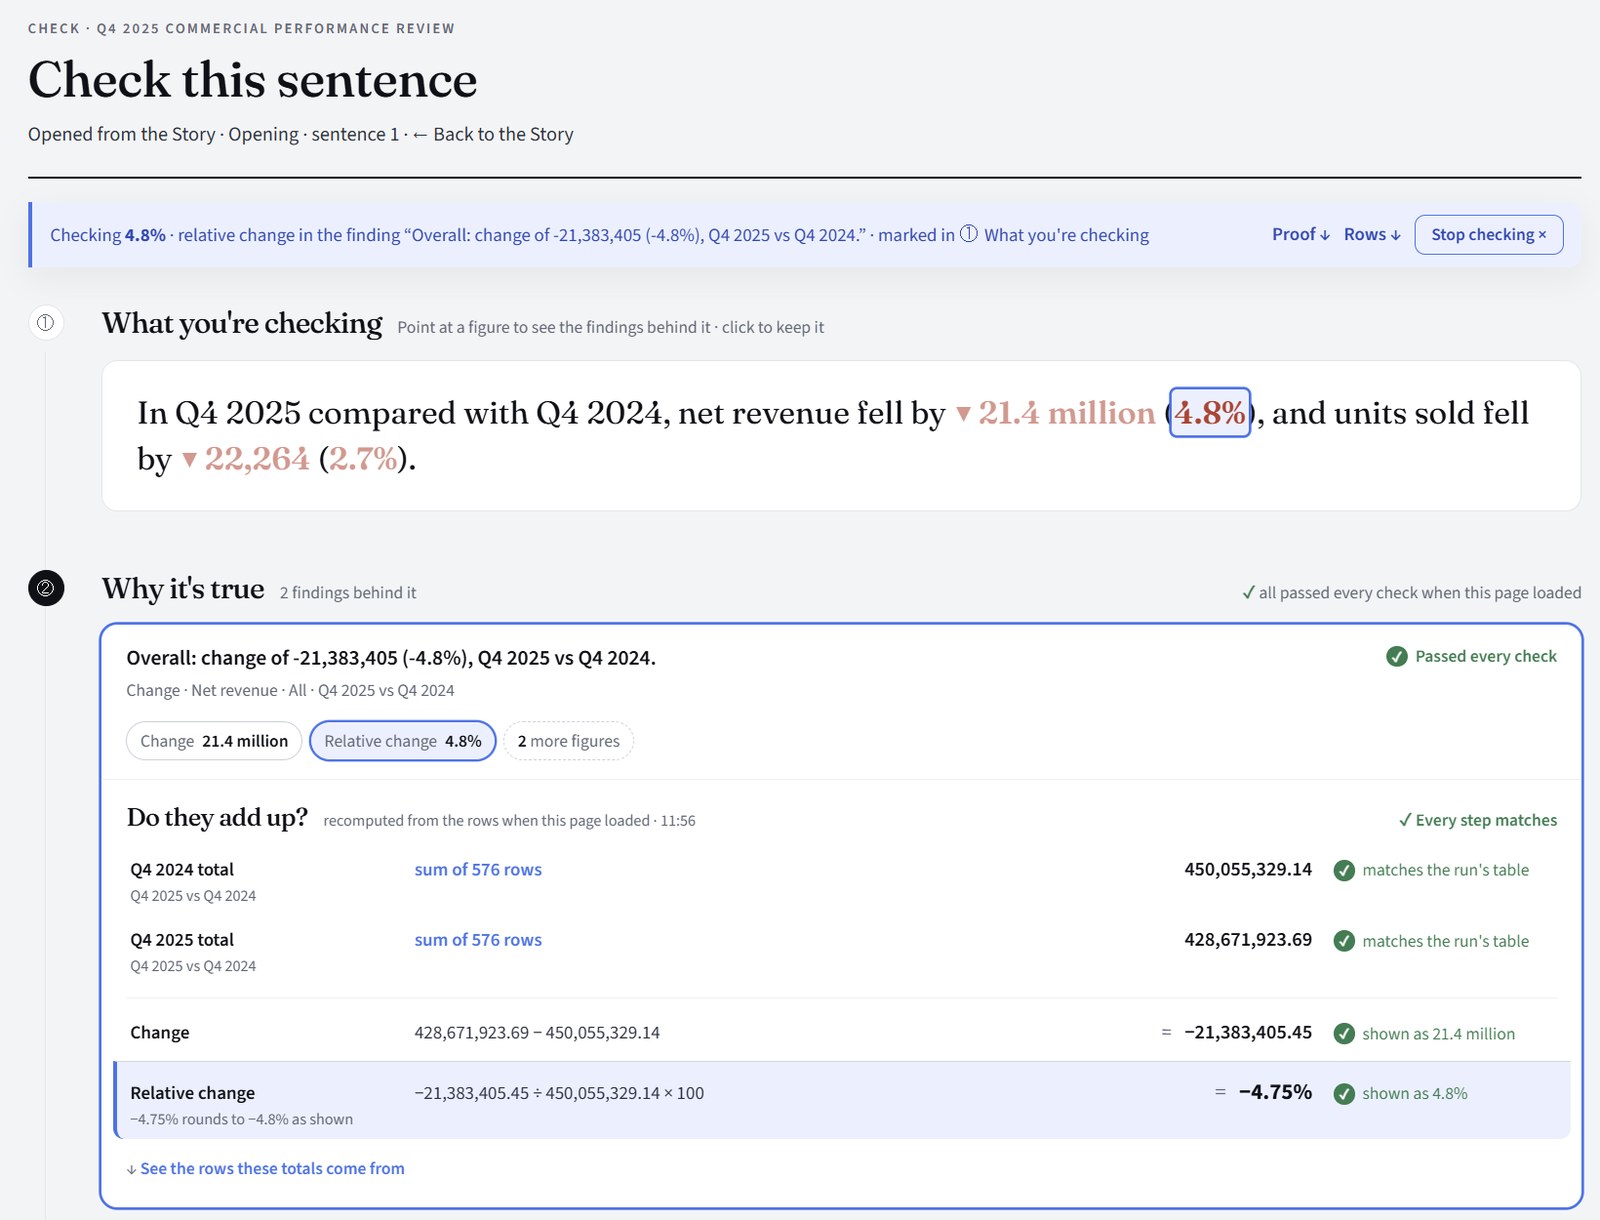
A Q4 2025 commercial review, as Evident delivered it. Synthetic sample data. The Story, a slide from its deck, and Check this on one figure: the 4.8% added up again from 576 rows.
AI tools answer in seconds, but you can't tell which numbers are real. A careful analyst gives you numbers you can trust, but takes days.
Evident gives you both: an answer in minutes, and numbers you can check.
One request, four ways to use it.
All from the same checked findings. Press Check this on any figure and the calculation behind it opens, added up again from your rows. Synthetic sample data throughout.
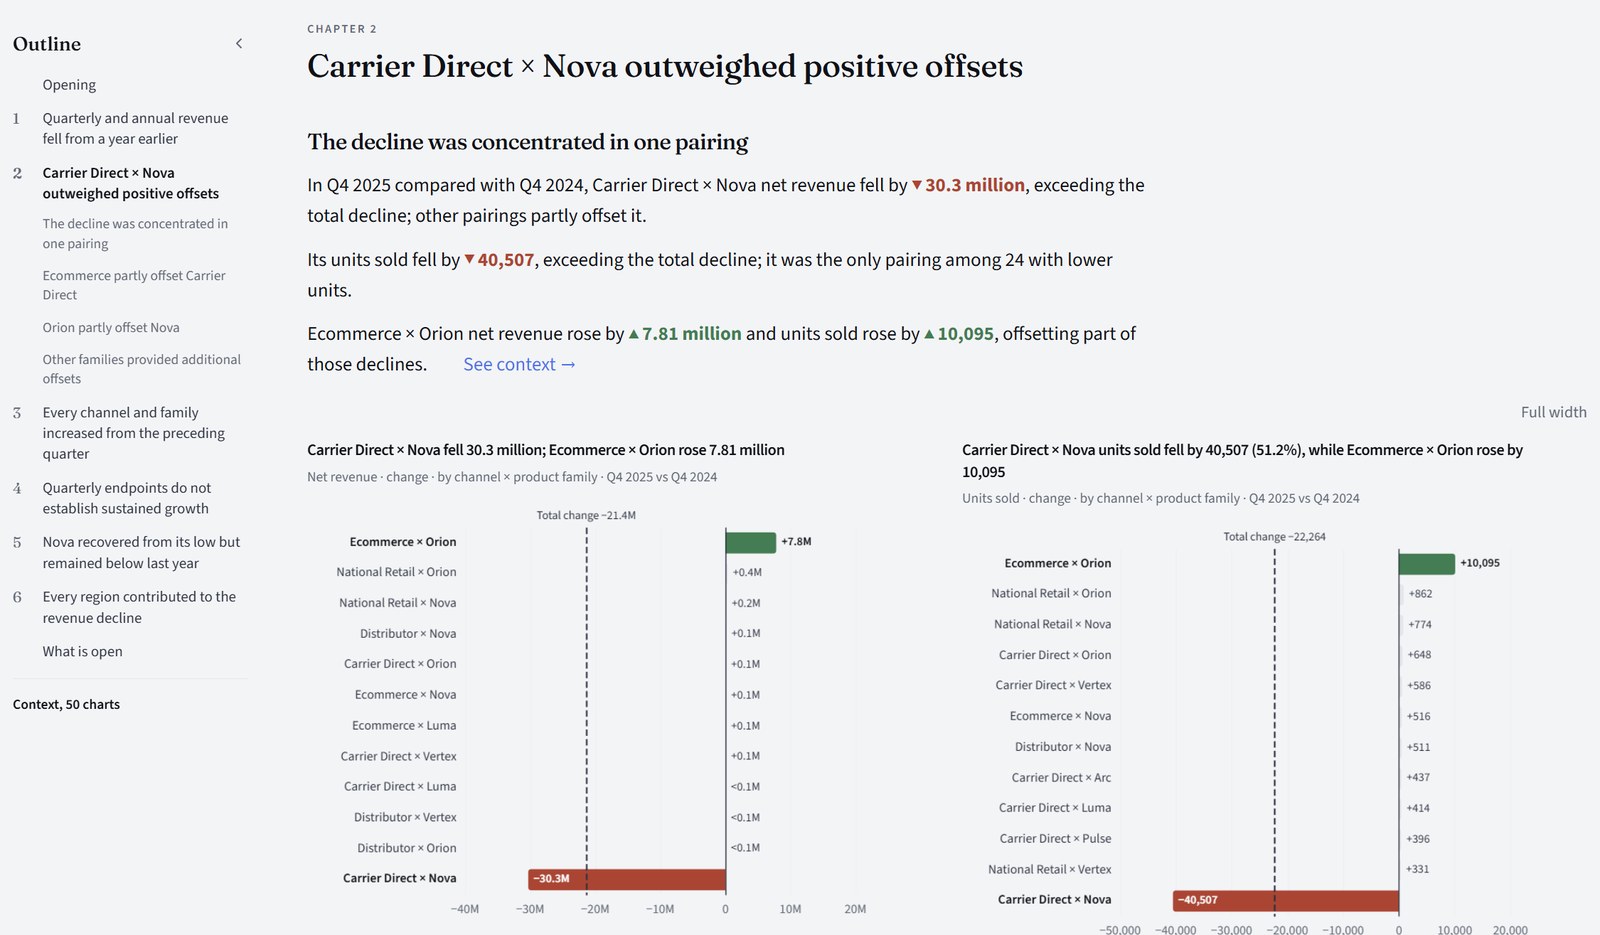
Context is the wider picture around the Story: trends, rankings, shares and spread, already computed and checked, on one dashboard.
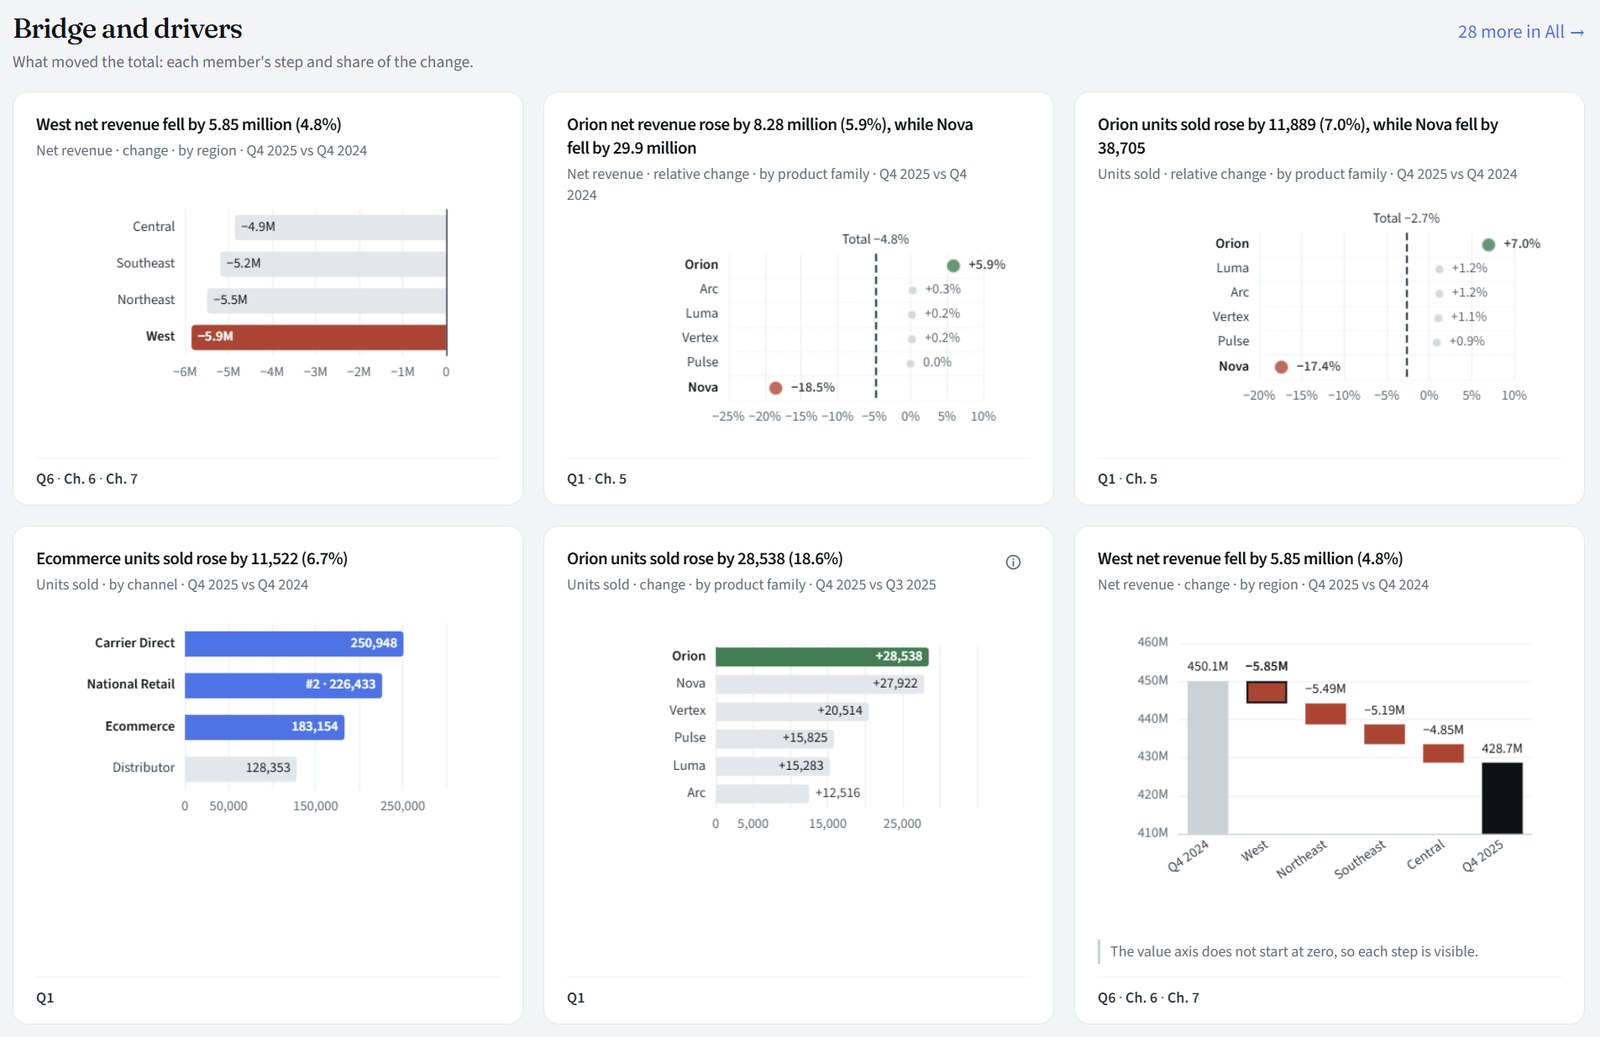
- What moved the total, member by member. The bridges behind each change, for every breakdown the run computed, including members the Story didn't name. From any Story point, See context opens the charts for that metric and breakdown.
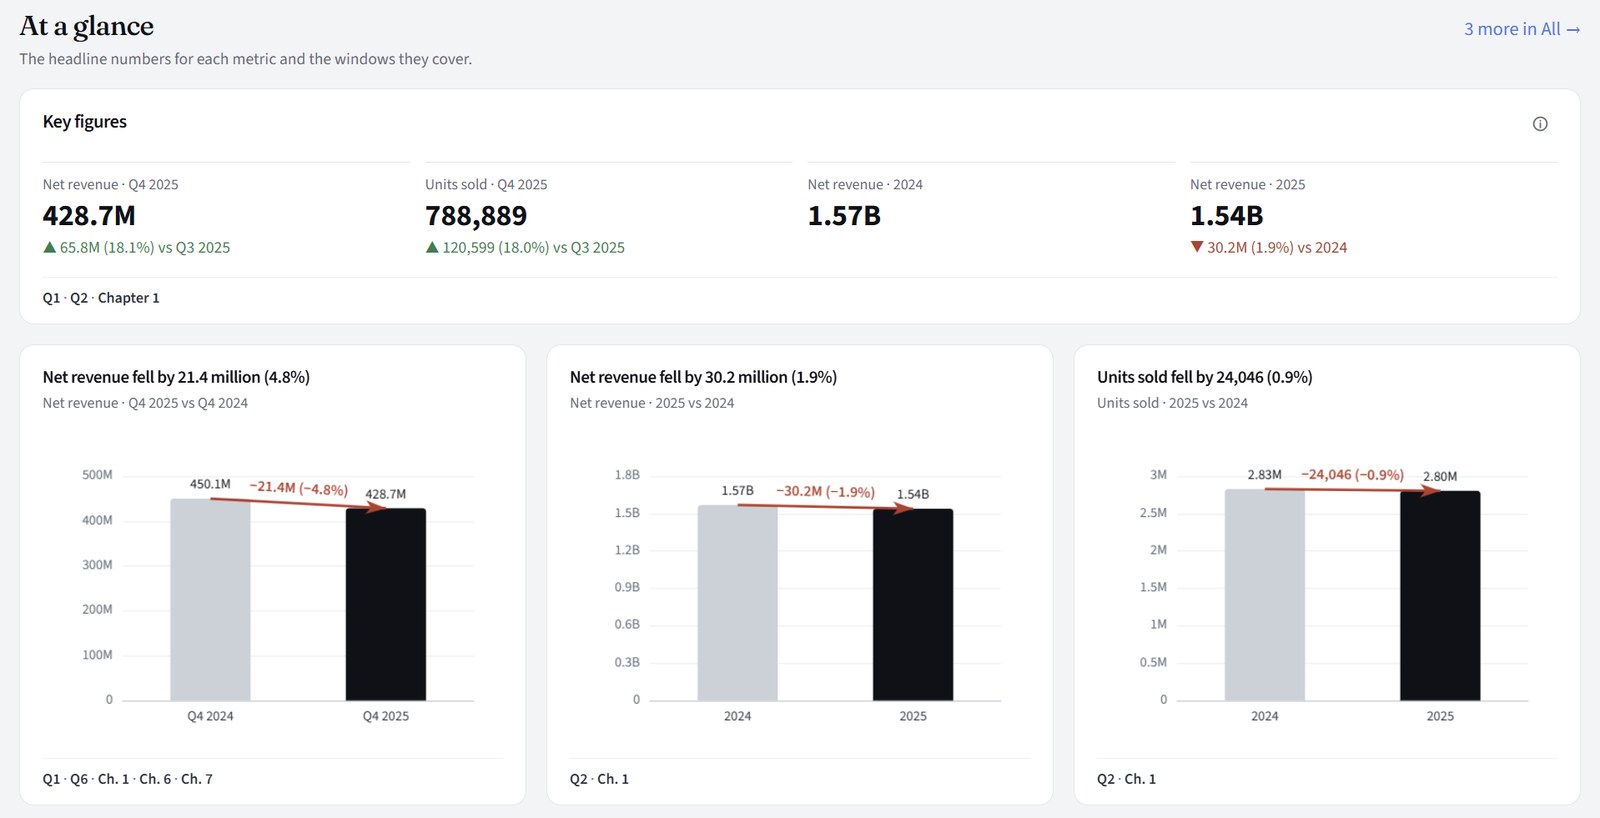
- More than the Story had room for. A run computes far more than its Story can tell. Context lays it out as one dashboard, ordered for the kind of question you asked, and tags every chart with the Question and chapter that use it.
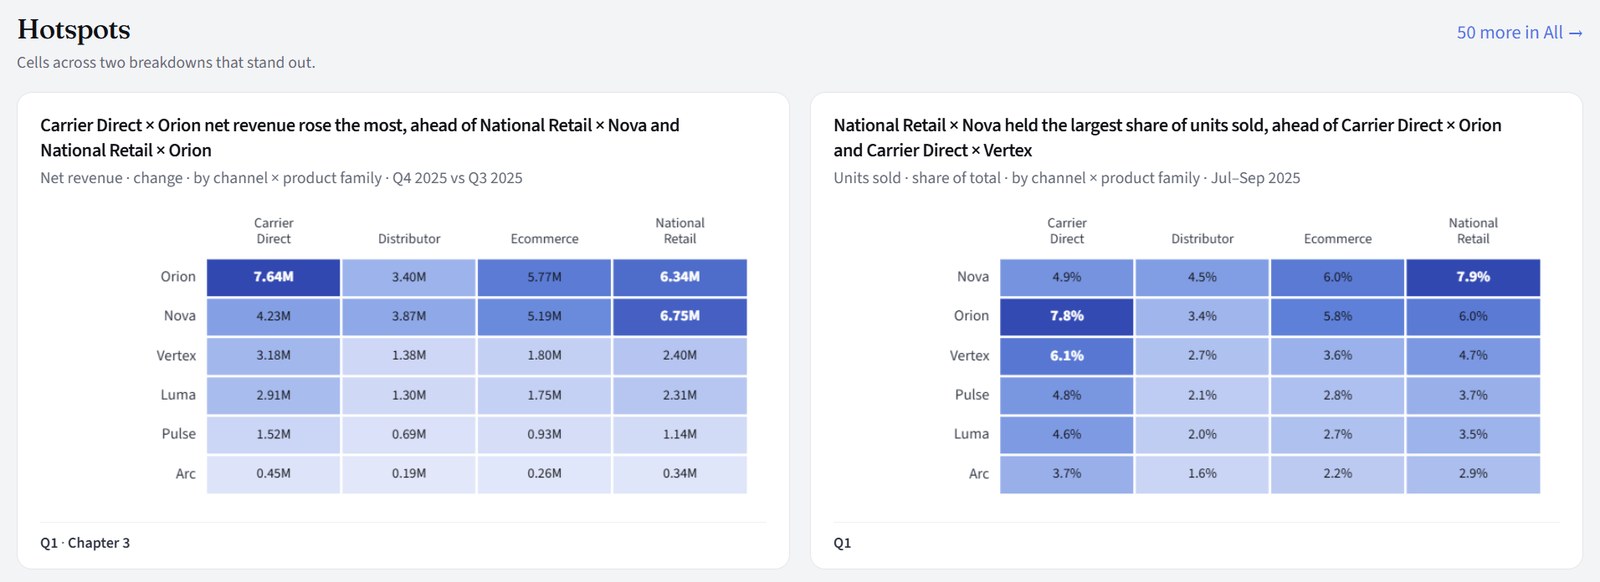
- What a reader asks next. Context also looks across two breakdowns at once and picks out the cells that stand out. Every chart on it is checked like the Story's: each plotted value equals the fact it came from.
Present turns the Story into a deck with no second pass, ready for PowerPoint.
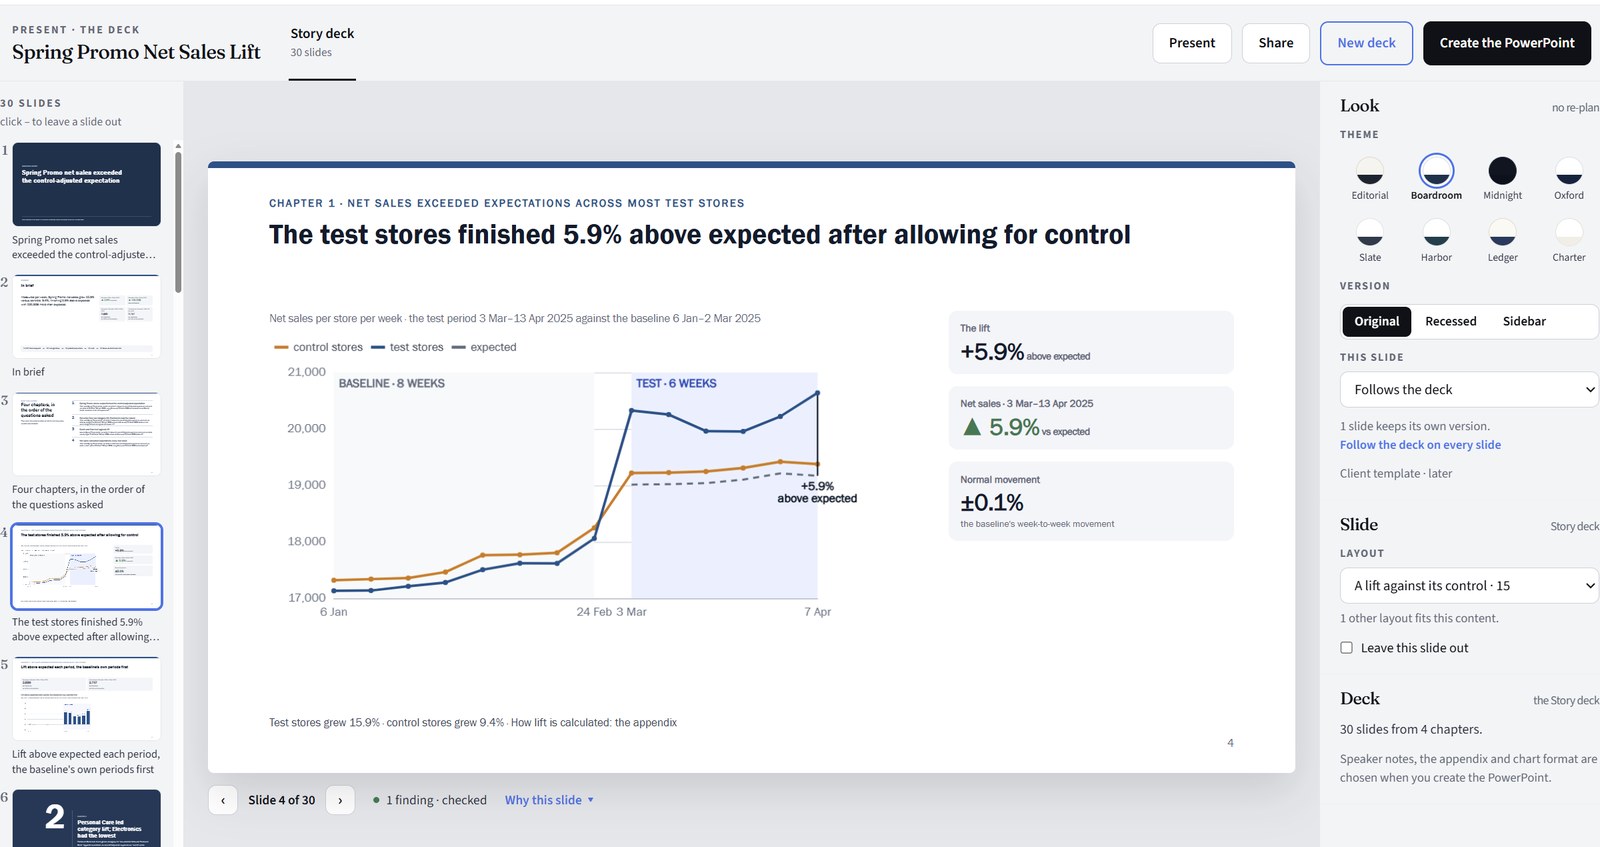
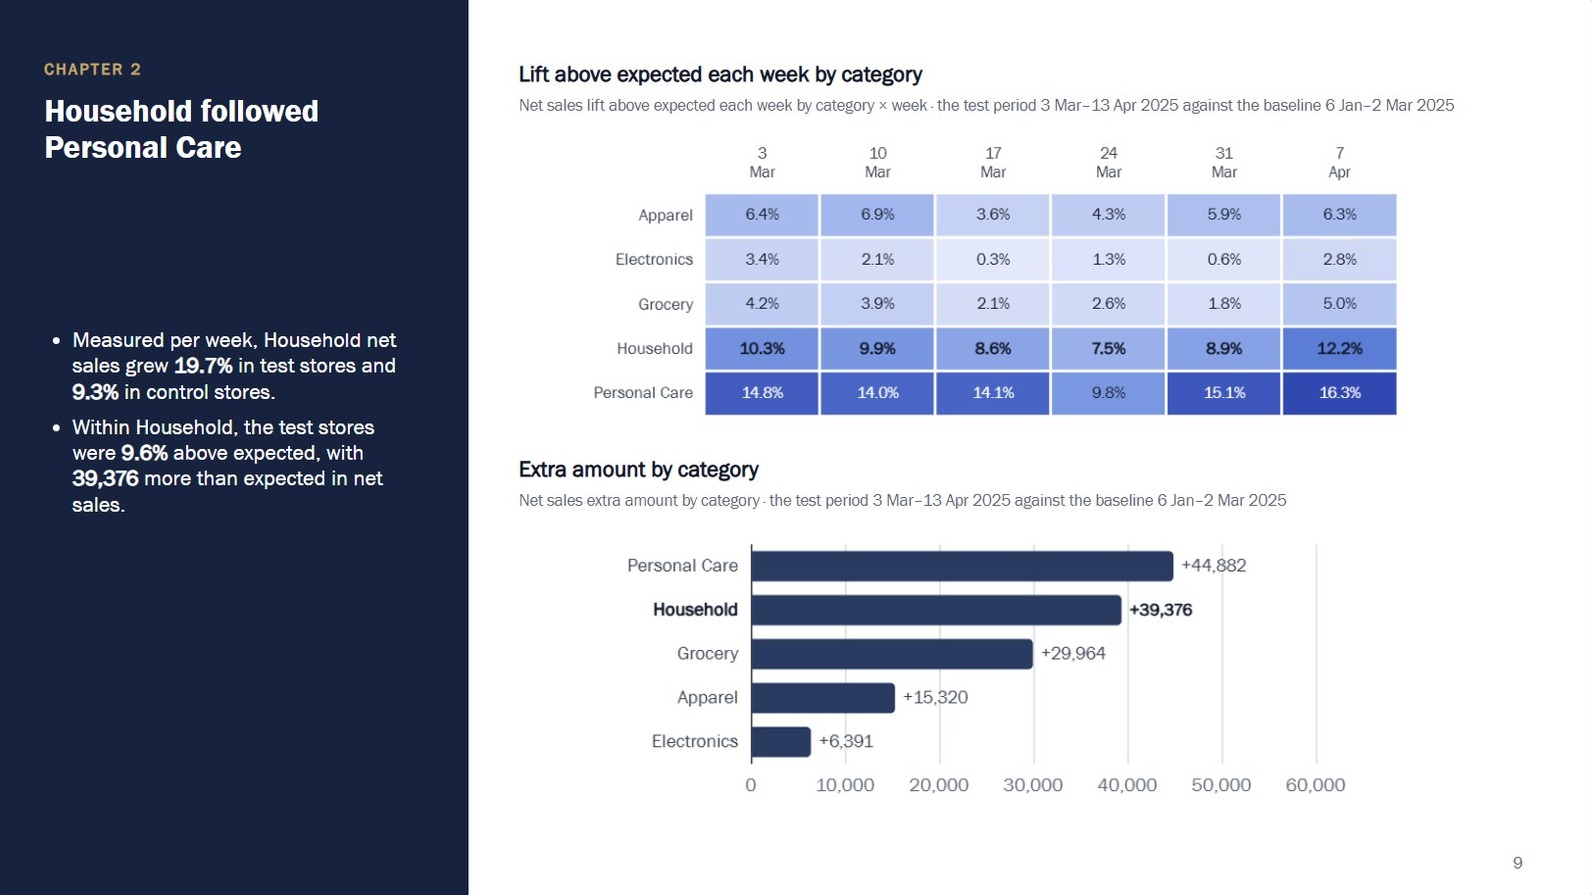
- A deck from the Story, not a rebuild. The Story becomes slides one point at a time, each with a layout chosen for what it holds. Leave slides out, pick one of eight themes, and see why each slide is there. Then create the PowerPoint, with charts you can edit or pictures exactly as on the page.
- Nothing new on a slide. Every line on a slide is a sentence from the Story, already checked, and every chart is the Story's chart. The deck recomputes nothing. A shorter deck for a particular audience is planned by the AI from the same findings, and anything it writes for a slide passes the same checks.
Did the promotion work, beyond what would have happened anyway?
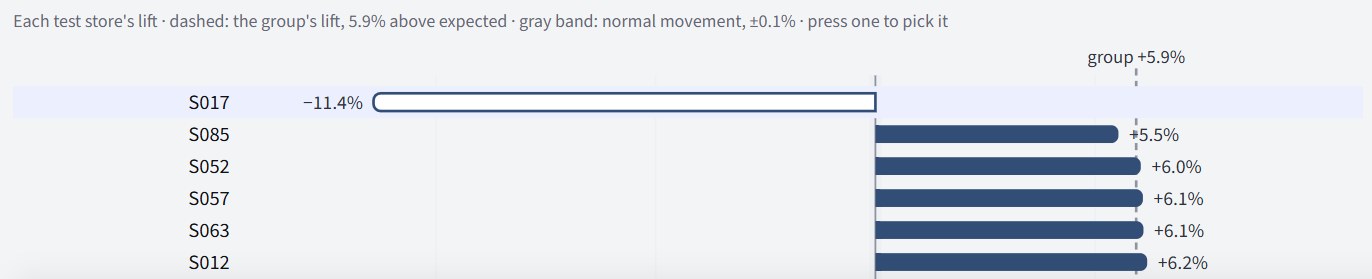
Evident compares a test group with a control group that didn't get the change, across a baseline period and the test period. The members can be stores, products, customers or anything else your data counts. It reports the lift: how much better the test group did than the control group says it would have done.
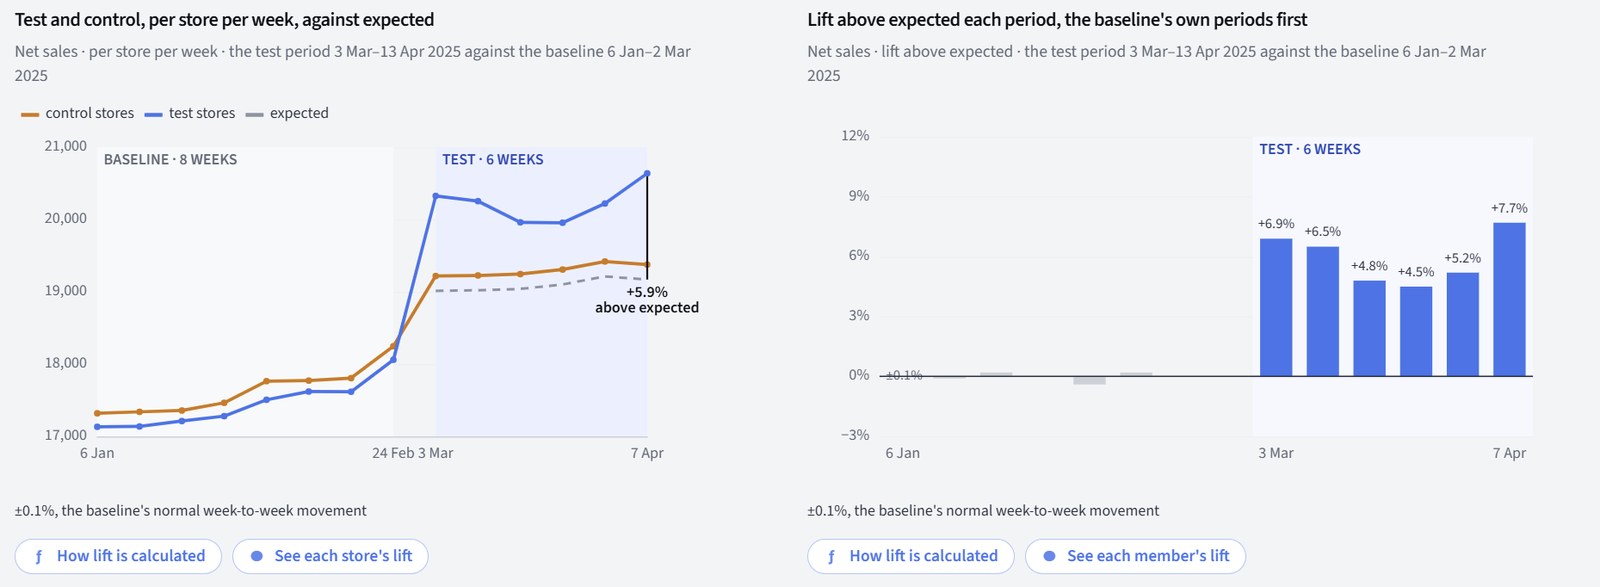

The comparison is checked, and each check says what it found. Before the run, the Brief checks the set-up: no member in both groups, every member present through both periods, periods that compare fairly, and enough members in each group. It lists each result before you approve and says which are worth a look.
From data to deck in minutes.
Five steps. Nothing runs until you approve the Brief, and the AI never sees your rows beyond an optional setup sample you control. Every step in detail →
A CSV or Excel file. Evident reads what each column means, checks the data's health, and proposes the definitions. You review them and publish.
AI sees: column names, types and counts, plus a sample of up to 10 rows if you allow it.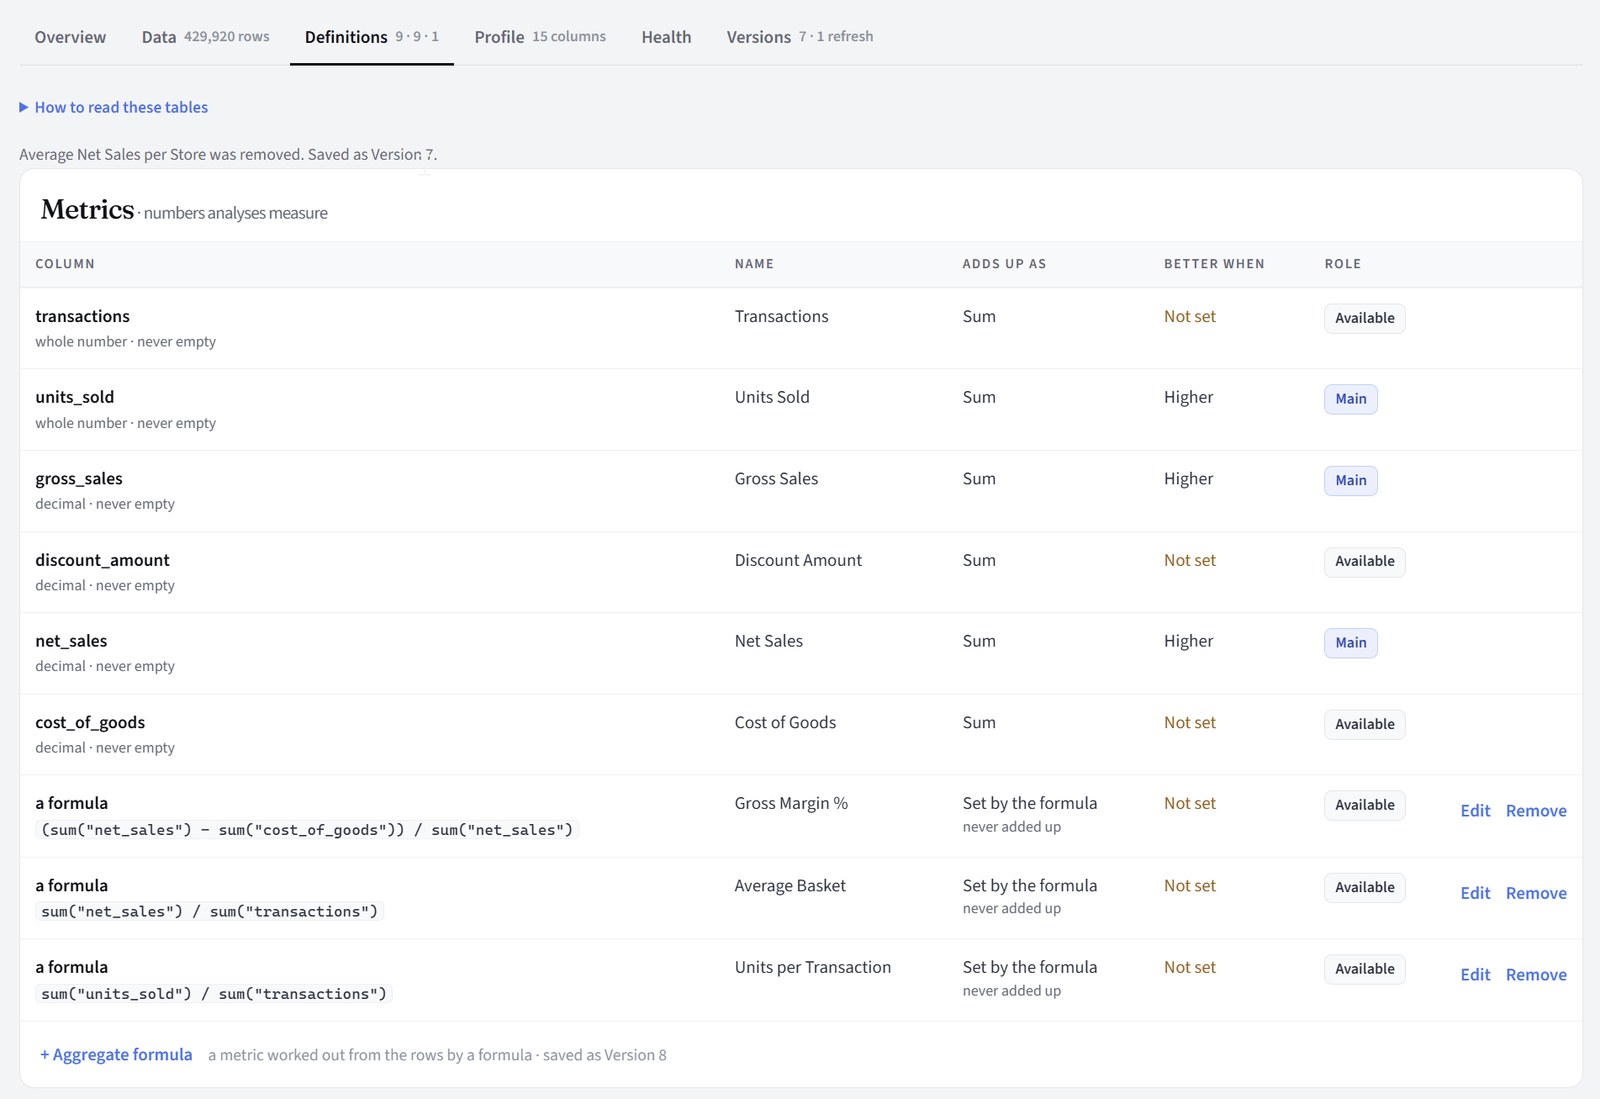
Write the request, or let Ask, the built-in assistant, talk it through with you and draft one. Here it has recognised a test against a control and drafted the request, marking what only you can fill in.
AI sees: your question and the Help pages; a dataset's definitions if you choose one. Never rows.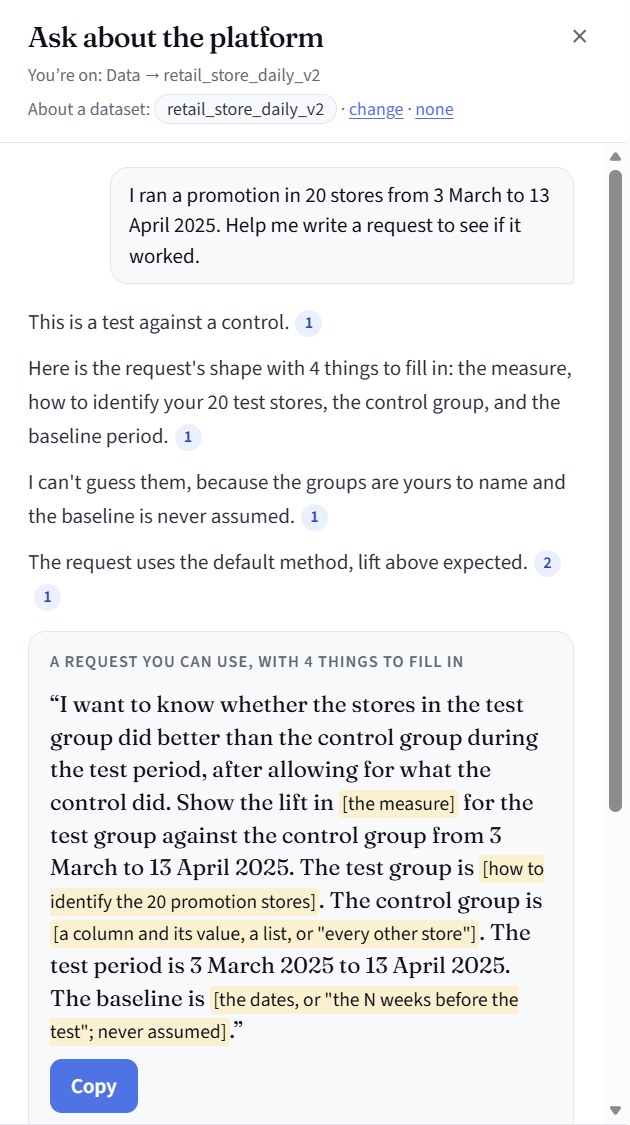
Exactly what will be calculated, before anything runs: your request as numbered outcomes, each with its calculations and a plain "Computed as" sentence. Where a request could be read more than one way, Evident asks you to confirm or choose. Edit anything, then approve.
AI sees: your request, the names of measures, breakdowns and categories, and the date range. Never rows or figures.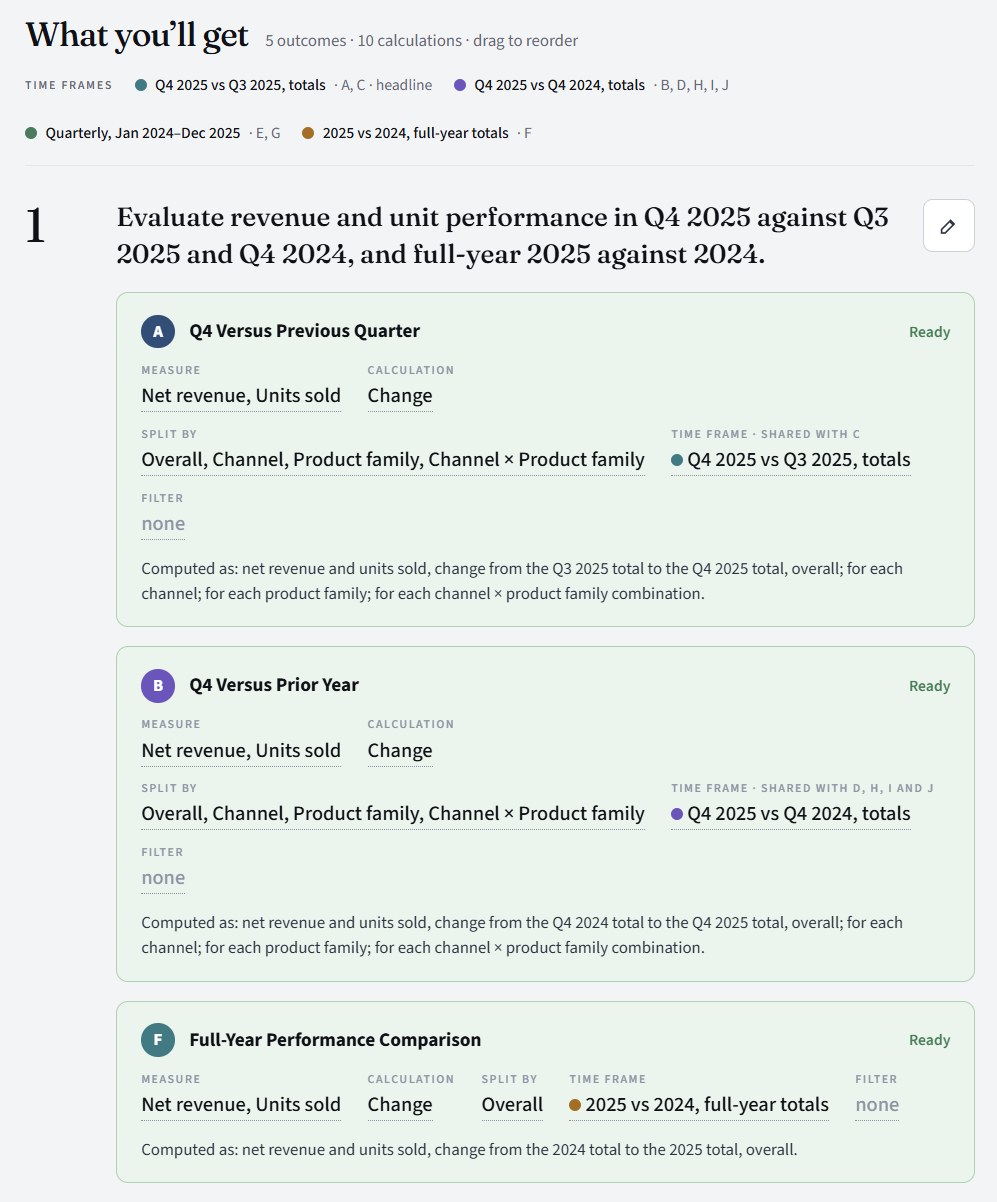
Every calculation runs as code over your rows. Then each finding is tested against its facts before it can be written, and each result opens as soon as it is ready.
AI sees: nothing while computing. Then the computed results per question, and the chosen findings, to write. Never rows.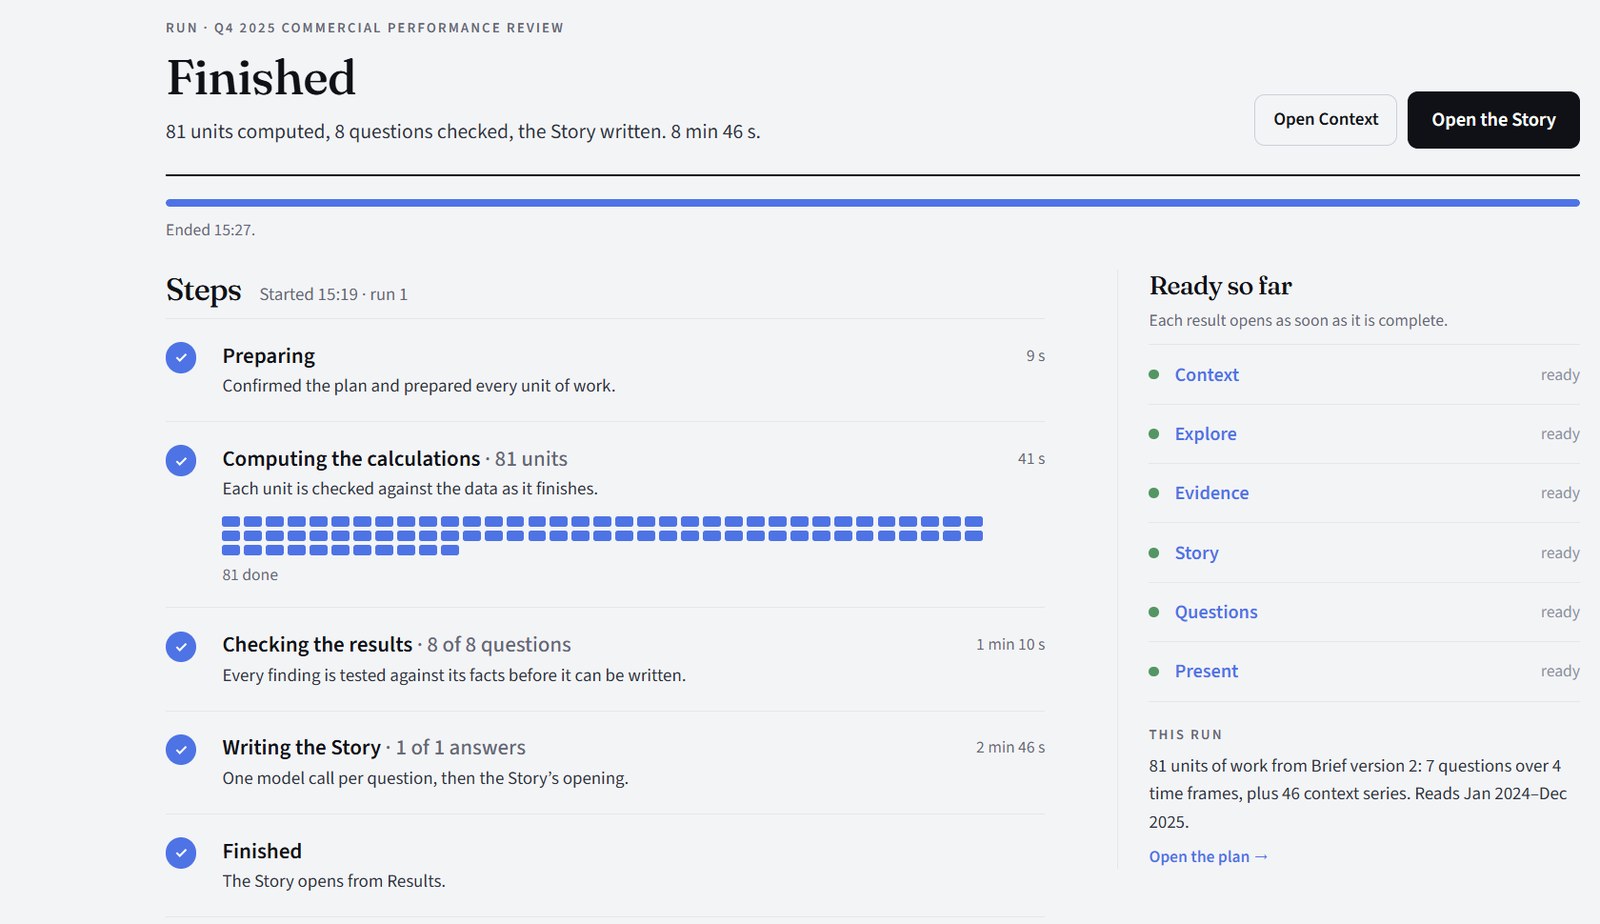
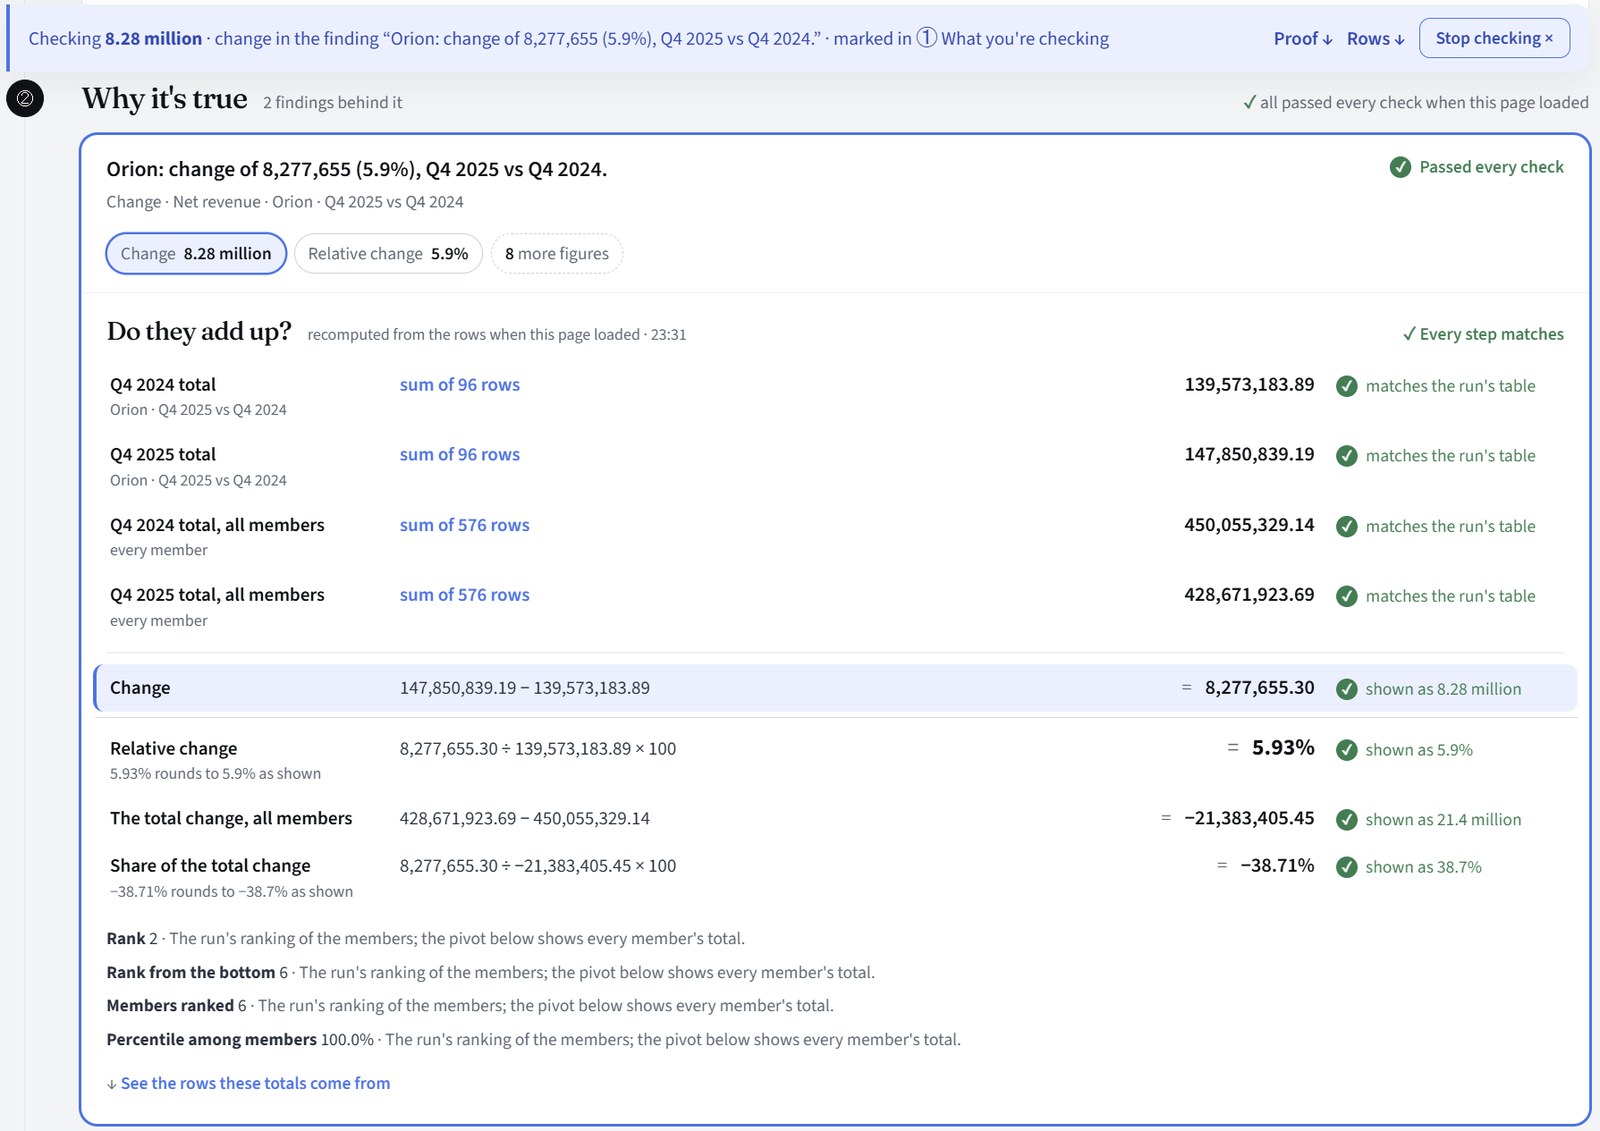
The Story, the check behind every figure, and the deck. Press Check this on a sentence and the arithmetic behind it opens: here the 4.8% of the opening, from two totals of 576 rows.
AI sees: nothing when you read or check, and nothing for the Story's own deck.Why you can trust every number
Code does the arithmetic and the checking. AI only chooses and explains, and everything it writes is checked before you read it.
Code computes every number
From your data's rows, the way a spreadsheet would. AI never writes a figure.
AI only chooses and explains
It chooses which computed findings matter and writes them up, inside guards that stop it drifting or changing the meaning.
Code checks every number and sentence
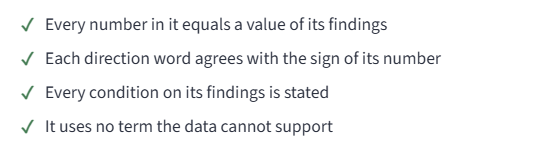
Everything the AI wrote is checked against the finding it came from: the numbers must still match, and the wording must pass. Anything that fails is dropped before you see it. When results are read, every number is matched again to the fact it came from.
Every number opens to its rows
In the Story, every sentence with a figure, every set of key figures and every chart has Check this. Press it: the totals behind the number are added up again from your rows, each step of the arithmetic is shown, and the rows themselves are there to filter, pivot or download.
In the review above, 19 findings failed a check and were dropped before the Story was written. None of them reached a page.
Your rows stay with Evident.
Evident computes every number itself, from your rows, on its own servers. An AI model reads your request and writes up the results. It never sees your rows, with one exception you control: at setup, you choose whether it may see a sample of up to ten rows to suggest what the columns mean.
- Where it runsAmazon Web Services in Ohio, behind Cloudflare. The server has no public address; every request comes through an encrypted tunnel, after sign-in.
- Who sees whatEach client is its own organization, with its workspaces walled apart by row-level security in the database, not only a rule in the app.
- The AI providerOpenAI's business API, every call with storing switched off. OpenAI does not train its models on API data.
- Single sign-onWith your identity provider and your two-step login rule: on request.
Evident is the last mile, built.
Connor Nobert built and led the analytics function for enterprise consumer-electronics and national retail clients. Pipelines and dashboards were slow and expensive too, but there were tools for them. There was no tool you could trust for the last mile, from clean data to a narrative and a deck people act on, so it was done by hand, every month.
- Finance-grade incentive reportingPrograms that paid out more than $10M to over 25,000 reps.
- Matched-control sales-lift analysisDesigned for a geo-targeted device-launch promotion, whose result approved the program's expansion. Test against a control is Evident's showcase for the same reason.
- How Evident was builtDesigned by Connor and built by directing AI coding agents, with written specs, self-testing change packages and a record of every change. Under the hood →